9.14 FX Daily EUR/USD
TOPICSFocus on EUR/USD today.
Fundamentally, Traders will pay more attention to European Central Bank interest rate decision tonight. As the Eurozone’s second-quarter GDP growth rate dropped from 0.3% to 0.1%, the latest PMI data also showed that economic activity in the service industry and manufacturing industry shrank intensified in August. The sluggish economy coupled with high inflation and the haze of stagflation make interest rate decision of the European Central Bank full of suspense. If the European Central Bank chooses to pause interest rate hikes for the first time in this year, without additional hawkish comments, the euro may fall further against the dollar.
Technically, the euro’s short trend has temporarily gained the upper hand on daily chart. The 200-day moving average has been exceeded, the exchange rate is completely below the 200-day moving average, and the 33-day moving average and the 65-day moving average have also formed a dead cross downward.

( Daily chart of EUR/USD, source: Ultima Markets MT4)
It is worth noting that when the short-term moving average group is close to the 200-day moving average, the market is likely to fluctuate. A complete short trend requires waiting for the short-term moving average group to fall below the 200-day moving average as well. Therefore, although the market started to rise this week, it is currently judged to be a rebound, and the rebound is weak.

(4-hour chart of EUR/USD, source: Ultima Markets MT4)
On the 4-hour chart, the overlap between 1.07665 and the 65-period moving average is a strong resistance area, and the market failed to break through twice. Before the market completely rises above this resistance, the power of shorts will always be slightly stronger than that of bulls.

(1-hour chart of EUR/USD, source: Ultima Markets MT4)
On the 1-hour chart, the flag-shaped area is still in progress. For trading opportunities, traders need to wait for the signal of the stochastic oscillator, or the market falls below the previous low.

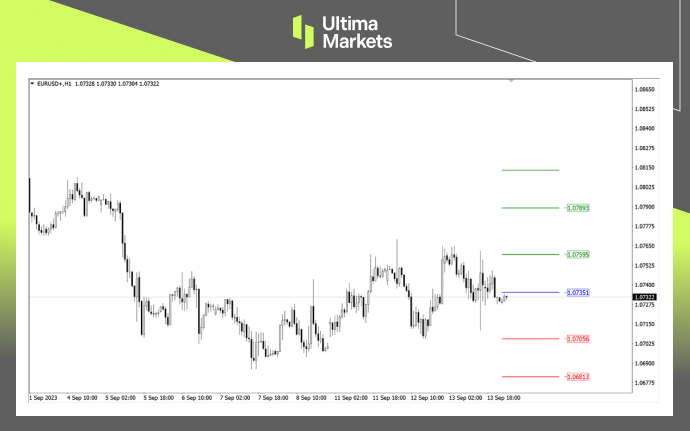
(1-hour chart of EUR/USD, source: Ultima Markets MT4)
According to the pivot indicator in Ultima Markets MT4, the central price of the day was 1.07351.
Bullish above 1.07351, first target 1.07595, second target 1.07893
Bearish below 1.07351, first target is 1.07056, second target is 1.06813
Disclaimer
Comments, news, research, analysis, prices and other information contained in this article can only be regarded as general market information, provided only to help readers understand the market situation, and do not constitute investment advice. Ultima Markets will not be responsible for any loss or loss (including but not limited to any loss of profits) that may arise from the direct or indirect use or reliance on such information.
Why Trade Metals & Commodities with Ultima Markets?
Ultima Markets provides the foremost competitive cost and exchange environment for prevalent commodities worldwide.
Start TradingMonitoring the market on the go
Markets are susceptible to changes in supply and demand
Attractive to investors only interested in price speculation
Deep and diverse liquidity with no hidden fees
No dealing desk and no requotes
Fast execution via Equinix NY4 server


