Comprehensive Brent Oil Analysis for October 18, 2023
In this comprehensive analysis, Ultima Markets brings you an insightful breakdown of the BRENT OIL for 18th October 2023.
Key Takeaways
- Demand for Crude oil remains strong: U.S. retail sales recorded a monthly rate of 0.7% in September, exceeding expectations of 0.3%, growing for six consecutive months. Strong consumer spending power suggests crude oil demand remains supportive.
- Crude oil production may increase: Saudi Aramco claimed that it can increase production within a few weeks if necessary. This is a factor affecting crude oil price fluctuations in the short term. However, on the basis of strong demand, oil prices still surged after the market digested this news.
- The Israeli-Palestinian conflict has not ceased: On the eve of Biden’s visit to Palestine, the Israeli military air raided hospitals in the Gaza Strip, killing more than 500 people. The Israeli military denied this. The market is weighing the possibility of expanding conflicts in the Middle East, and risk aversion still supports oil prices.
Brent Oil Technical Analysis
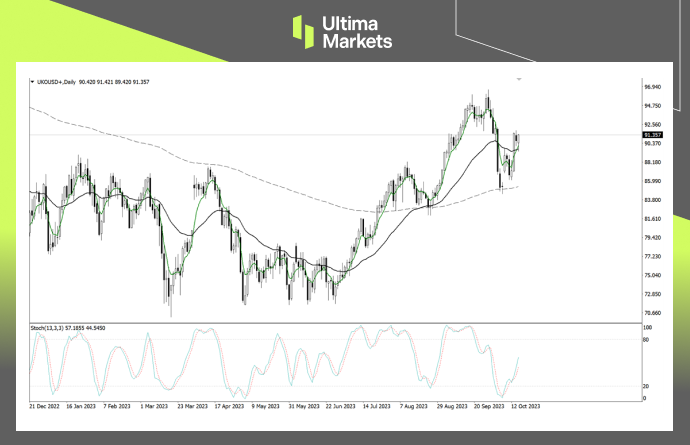
Brent Oil Daily Chart Insights

- Price Action: After two trading days oscillating, the price was blocked by the 33-day moving average (black) and closed with a pin bar. The final closing price also stood above the 5-day moving average (green). The short-term adjustment of the market may have already finished.
- Stochastic Oscillator: The price still has not broken through last Friday’s high. The stochastic indicator are very fragile. Bulls have the motivation to break through the previous high. Otherwise, the market will fall into a longer period of correction.
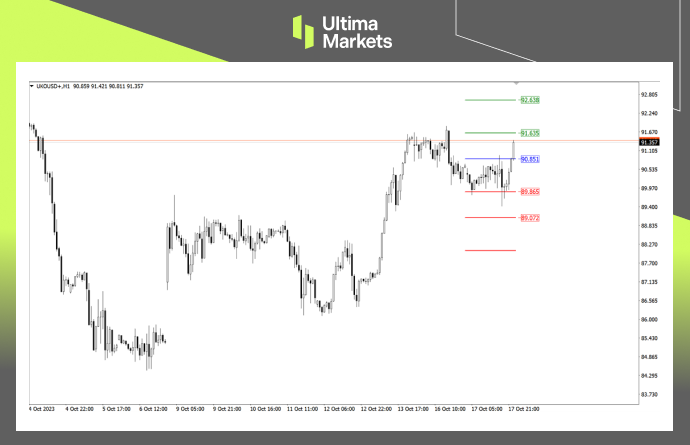
Brent Oil 1-hour Chart Analysis

- Alternative trend lines: Ultima Markets has previously shared the use of alternative trend lines. Such a structure has appeared on the 1-hour cycle of crude oil. The rapid rise stepped back on the alternative trend line (red), and the price stepped back on it again yesterday. At the same time, a pin bar appeared. The subsequent upward trend suggested that the adjustment has ended.
- The key resistance level: $90.8 is an important resistance level for crude oil. It is also the neckline of the top structure. It suggested that the bulls were beginning to gain the upper hand.
- Stochastic Oscillator: The technical indicator once again formed a golden cross.Bulls will maintain momentum until the indicator completely enters the overbought zone.
Ultima Markets Pivot Indicator

- According to the pivot indicator in Ultima Markets MT4, the central price of the day is established at 90.851,
- Bullish Scenario: Bullish sentiment prevails above 90.851, first target 91.635, second target 92.638;
- Bearish Outlook: In a bearish scenario below 90.851, first target 89.865, second target 89.072.
Conclusion
Legal Documents
Ultima Markets, a trading name of Ultima Markets Ltd, is authorized and regulated by the Financial Services Commission “FSC” of Mauritius as an Investment Dealer (Full-Service Dealer, excluding Underwriting) (license No. GB 23201593). The registered office address: 2nd Floor, The Catalyst, 40 Silicon Avenue, Ebene Cybercity, 72201, Mauritius.
Disclaimer
Comments, news, research, analysis, price, and all information contained in the article only serve as general information for readers and do not suggest any advice. Ultima Markets has taken reasonable measures to provide up-to-date information, but cannot guarantee accuracy, and may modify without notice. Ultima Markets will not be responsible for any loss incurred due to the application of the information provided.
Copyright © 2023 Ultima Markets Ltd. All rights reserved.
Warum mit Ultima Markets Metalle und Rohstoffe handeln?
Ultima Markets bietet das wettbewerbsfähigste Kosten- und Börsenumfeld für gängige Rohstoffe weltweit.
Mit dem handel beginnenÜberwachung des Marktes von unterwegs
Märkte sind anfällig für Veränderungen in Angebot und Nachfrage
Attraktiv für Anleger, die nur an Preisspekulationen interessiert sind
Umfangreiche und vielfältige Liquidität ohne versteckte Gebühren
Kein Dealing Desk und keine Requotes
Schnelle Ausführung über den Equinix NY4-Server


